|
Click image to enlarge
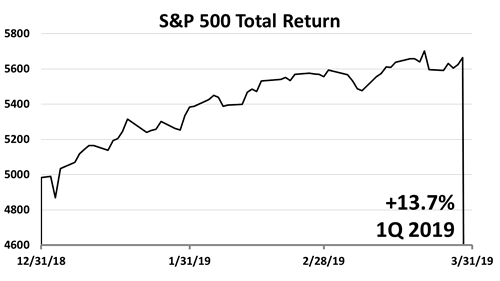
S&P 500 SURGES SHARPLY IN Q12019
Stocks posted a surprising +13.7% gain in Q12019 after a 4Q2018 loss of -13.5%. The S&P500 stock index posted a +7.7% total return in 3Q2018, a +3.4% return in 2Q, and a -0.8% loss in 1Q2018. As the quarter ended, investor psychology showed signs of a change, and stock market indexes hovered near all-time highs.

Click image to enlarge
PLUNGE ENDED 9-YEAR 11-MONTH BULL RUN
Over the one-year period ended March 31st, 2019, China was the laggard among bourses worldwide, as prospects of a trade war with the U.S. mounted. While China’s economy would shrink materially if exports to the U.S. were stopped, U.S. GDP was expected to suffer only fractionally from a China trade war.

Click image to enlarge
INTEREST RATES DROVE SECTORS
The yield on a 10-year Treasury bond plunged, from 2.69% to 2.41% in Q1, which boosted utilities to income investors. The yield curve — the difference between 10-year T-bonds and 90-day T-Bills — inverted at the end of 2018, hurting bank and financials stocks.

Click image to enlarge
INDEXES TRACKING 13 ASSET CLASSES
The S&P 500 index’s total return of +68% over the five years shown was almost four times the S&P Global ex-U.S. stock market’s return of +18%. It is testament to how resiliently the U.S. economy came out of the last severe global recession and U.S. growth outpaced other world economies and asset classes.
Click image to enlarge
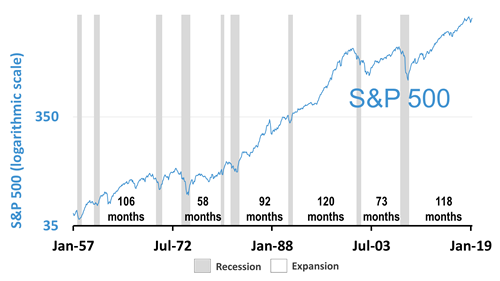
S&P 500 AND POST-WAR EXPANSIONS
At 118-months old, this expansion, following on the 2008 Global Financial Crisis is highly likely to exceed the longest boom in post-War history, the 120-month long stretch in the 1990s. Unless a black swan event were to occur, continued strong fundamentals may make this the longest expansion in modern history.
Click image to enlarge
EQUITY RISK PREMIUM
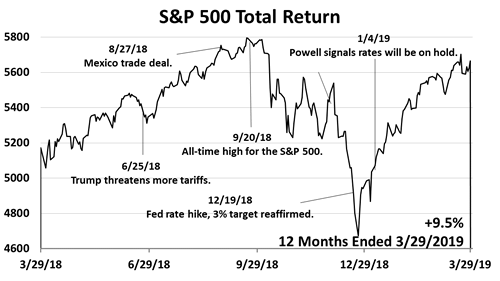
The S&P 500 hit a record all-time high on September 20th, 2018, then dropped -19.8% to a Christmas Eve low. Rounding makes it qualify as a bear market drop of 20%. But it was a short bear run. The plunge occurred after the Fed’s December 19th decision to raise lending rates a quarter of 1%.
Past performance is never a guarantee of your future results. Indices and ETFs representing asset classes are unmanaged and not recommendations. Foreign investing involves currency and political risk and political instability. Bonds offer a fixed rate of return while stocks fluctuate. Investing in emerging markets involves greater risk than investing in more liquid markets with a longer history.
|